
Script Configuration UI
When the user clicks the ⚙ button on a script's legend, the chart pushes a ConfigureScript(ScriptId) event. This page covers how to build the resulting configuration dialog using the ScriptManagement trait methods.
ChartView vs ChartView
Use cv.script_inputs_effective(id) (ChartView) or cv.script_inputs(id) (ChartView) to get the current inputs with defaults merged. Use cv.set_script_config_with_complete(id, config, callback) (ChartView) or cv.set_script_config(id, config) (ChartView) to apply changes.
Building a Configuration UI
This section describes how to build a configuration dialog for script settings.
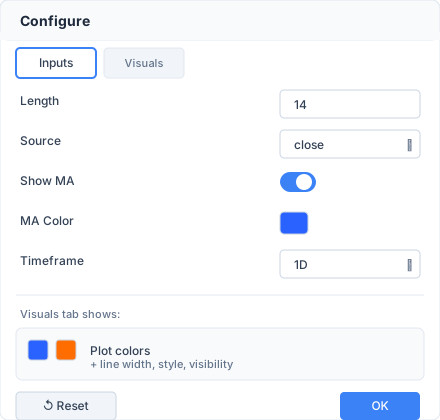
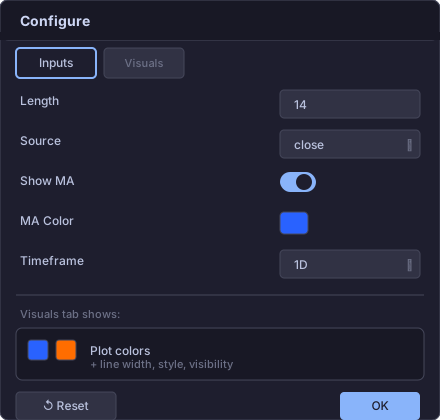
Dialog Structure
The dialog has two tabs:
| Tab | Content | Show when |
|---|---|---|
| Inputs | Script input.*() parameters | inputs.len() > 0 |
| Visuals | Series graph visual overrides (colors, styles) | graph_configs is non-empty |
The dialog should default to the Inputs tab if it has inputs, otherwise Visuals.
Footer buttons:
- Reset to Defaults — clears all overrides and resets inputs to original values.
- OK — closes the dialog (changes are applied immediately, no confirmation needed).
Inputs Tab
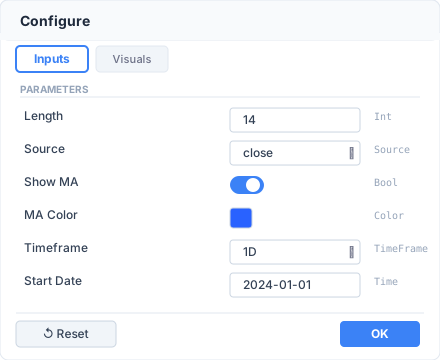
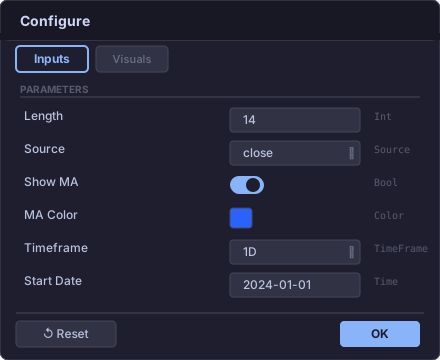
The ConfigureScript event provides a Vec<InputInfo>:
pub struct InputInfo {
    pub idx: usize,                       // Zero-based input index (key for input_values)
    pub title: Option<String>,            // Human-readable label
    pub tooltip: Option<String>,          // Hover text
    pub group: Option<String>,            // Grouping header (optional)
    pub kind: InputKind,                  // Type-specific value + constraints
    pub default_value: serde_json::Value, // Script's original default (for "Reset to Defaults")
}
Render each input according to its InputKind variant:
Int { value, min, max, step, options } — Number input. If options is non-empty, show a dropdown instead of a free-form input. Respect min, max, step constraints.
Float { value, min, max, step, options } — Number input with decimal step (default 0.1). Same behavior as Int regarding options, min, max.
Bool { value } — Toggle switch.
Color { value } — Color swatch + color picker popup. Color is a packed u32 in RGBA format: (R << 24) | (G << 16) | (B << 8) | A. Display as a filled rectangle with the color; click to open a color picker with hex input and alpha slider.
Str { value, options } — Text input. If options is non-empty, show a dropdown instead.
Source { value } — Dropdown with fixed options: open, high, low, close, hl2, hlc3, ohlc4, hlcc4. The value is a SourceType enum. When writing to input_values, convert to the integer discriminant: open=0, high=1, low=2, close=3, hl2=4, hlc3=5, ohlc4=6, hlcc4=7.
Enum { value, options } — Dropdown. options is Vec<(i64, String)> — (discriminant, display label) pairs. Store the discriminant in input_values.
Symbol { value } — Text input for a ticker symbol (e.g. "AAPL").
TimeFrame { value, options } — Dropdown or text input. Value is a TimeFrame. If options is non-empty, show a dropdown.
Session { value, options } — Text input or dropdown for a session string (e.g. "0930-1600").
Time { value } — Date/time picker. Value is milliseconds since epoch (i64). Convert to/from a date-time using the script's exchange timezone (available via cv.timezone()).
TextArea { value } — Multi-line text area.
Applying input changes:
let mut config = cv.script_config(id).unwrap_or_default();
// For an Int input at index 0 with value 20:
config.input_values.insert(0, serde_json::json!(20));
// For a Source input, store the integer discriminant:
config.input_values.insert(1, serde_json::json!(3)); // close
cv.set_script_config(id, config);
Changes should be applied immediately (live preview) — the chart re-executes the script and re-renders automatically when done.
Strategy Configuration Tab
For strategy scripts, you may expose a dedicated tab (or section) that lets users override the strategy() execution parameters without editing the source. These overrides live in ScriptConfig::strategy_config_override.
use navi_vm::StrategyConfigOverride;

let mut config = cv.script_config(id).unwrap_or_default();
config.strategy_config_override = Some(StrategyConfigOverride {
    initial_capital: Some(50_000.0),
    commission_value: Some(0.1),
    ..Default::default()
});
cv.set_script_config(id, config);
StrategyConfigOverride fields (all Option<T>, None = use script default):
| Field | Description | Default |
|---|---|---|
initial_capital | Initial account equity | 1_000_000 |
commission_type | Commission mode: percent, cash_per_contract, or cash_per_order | percent |
commission_value | Commission amount. When percent: percentage points (1 = 1%). When cash_per_contract or cash_per_order: absolute currency amount per contract or order. | 0 |
margin_long | Margin requirement for long positions, as a percentage | 100 |
margin_short | Margin requirement for short positions, as a percentage | 100 |
slippage | Slippage per fill, in ticks | 0 |
pyramiding | Maximum number of entries allowed in the same direction | 0 |
risk_free_rate | Annual risk-free rate (%) used for Sharpe and Sortino ratios | 2 |
process_orders_on_close | Fill orders at bar close instead of next bar open | false |
calc_on_order_fills | Re-execute the script after each order fill | false |
backtest_fill_limits_assumption | Extra ticks beyond limit price required before a limit order fills | 0 |
close_entries_rule | Which open entry to close first: FIFO or ANY | FIFO |
Changes to strategy_config_override trigger a full session restart (same as input value changes), because the backtest results depend on these parameters.
Visuals Tab
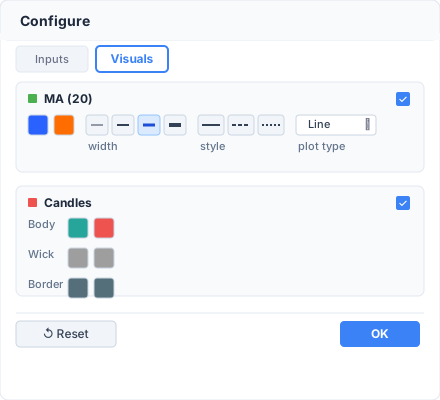
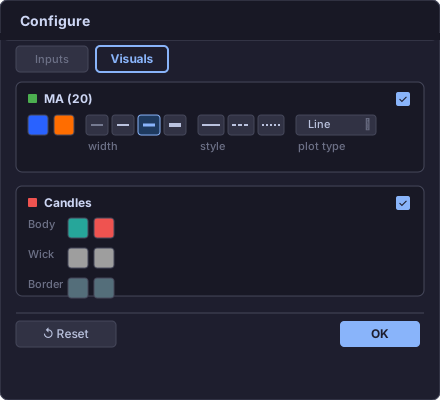
The Visuals tab shows visual overrides for each series graph. Fetch the data:
let graph_configs: HashMap<SeriesGraphId, SeriesGraphConfig> = cv.graph_configs(id).unwrap();
let overrides: HashMap<SeriesGraphId, SeriesGraphOverride> = cv.script_overrides(id).unwrap();
SeriesGraphConfig Variants
SeriesGraphConfig describes the original (pre-override) visual state. Each variant maps to a plot type:
pub enum SeriesGraphConfig {
    Plot {
        title: Option<String>,
        colors: Vec<Option<Color>>,          // Distinct color slots
        line_width: i32,
        style: PlotStyle,
        line_style: PlotLineStyle,
    },
    PlotChar {
        title: Option<String>,
        colors: Vec<Option<Color>>,
        char_value: char,
        location: Location,
        size: Size,
    },
    PlotShape {
        title: Option<String>,
        colors: Vec<Option<Color>>,
        style: Shape,
        location: Location,
        size: Size,
    },
    PlotArrow {
        title: Option<String>,
        up_colors: Vec<Option<Color>>,       // Up-arrow color slots
        down_colors: Vec<Option<Color>>,     // Down-arrow color slots
    },
    PlotCandle {
        title: Option<String>,
        colors: Vec<Option<Color>>,          // Body color slots
        wick_colors: Vec<Option<Color>>,
        border_colors: Vec<Option<Color>>,
    },
    PlotBar {
        title: Option<String>,
        colors: Vec<Option<Color>>,
    },
    BackgroundColor {
        title: Option<String>,
        colors: Vec<Option<Color>>,
    },
    Fill {
        title: Option<String>,
        colors: Vec<Option<Color>>,
    },
}
Color slots: The colors vectors contain the distinct colors used by the script (first-appearance order). None represents na / theme-default. Each slot has a corresponding position in SeriesGraphOverride::color_overrides.
SeriesGraphOverride
pub struct SeriesGraphOverride {
    pub color_overrides: Vec<Option<Color>>,
    pub line_width: Option<i32>,
    pub style: Option<PlotStyle>,
    pub line_style: Option<PlotLineStyle>,
    pub char_value: Option<char>,
    pub shape: Option<Shape>,
    pub location: Option<Location>,
    pub size: Option<Size>,
    pub line_width_overrides: Vec<Option<i32>>,
    pub line_style_overrides: Vec<Option<PlotLineStyle>>,
    pub visible: bool,  // defaults to true
}
UI Layout
The Visuals tab renders a vertical list of sections — one per series graph, ordered by SeriesGraphId. Each section shows:
- A header row with the graph title (from
SeriesGraphConfig::title) or a generated name like "Plot #1". - Color swatches — one per distinct color slot.
- Property controls — type-specific (style, width, shape, etc.).
- A visibility toggle — checkbox or switch controlling
SeriesGraphOverride::visible.
Plot (line/area/histogram)
The most complex type — each color slot has its own line style and width:
| Control | Field | Values |
|---|---|---|
| Color swatch (per slot) | color_overrides[i] | Color picker. Display as a filled rectangle with the effective color. None slots show a crosshatch or "auto" indicator. |
| Line width (per slot) | line_width_overrides[i] | Button group: 1, 2, 3, 4 px. Falls back to global line_width if unset. |
| Line style (per slot) | line_style_overrides[i] | Button group or dropdown: Solid, Dashed, Dotted. Falls back to global line_style. |
| Plot style (global) | style | Dropdown with all PlotStyle values — see table below. |
| Visibility | visible | Checkbox / toggle switch. |
PlotStyle enum values:
| Value | Description |
|---|---|
Line | Continuous line connecting bar values |
LineBr | Line with breaks at na values (no interpolation) |
StepLine | Step/staircase line |
StepLineBr | Step line with breaks at na |
Area | Filled area under the line |
AreaBr | Area with breaks at na |
Histogram | Vertical bars from zero line |
Columns | Filled columns from zero line |
Circles | Circle marker at each bar |
Cross | Cross marker at each bar |
Diamond | Diamond marker at each bar |
PlotLineStyle enum values:
| Value | Dash pattern |
|---|---|
Solid | No dashes |
Dashed | [6, 3] |
Dotted | [2, 2] |
Per-slot overrides layout: line_width_overrides and line_style_overrides are parallel arrays indexed identically to color_overrides. If the array is shorter than the number of color slots, missing entries use the global line_width / line_style override (or the config default).
Example: A plot with 3 distinct colors renders 3 rows, each with a color swatch + line width buttons + line style buttons:
[■ #2962FF] [1] [2] [3] [4]  [━━] [╌╌] [∙∙]
[■ #FF6D00] [1] [2] [3] [4]  [━━] [╌╌] [∙∙]
[■ #00BCD4] [1] [2] [3] [4]  [━━] [╌╌] [∙∙]
Style: [Line ▾]                    ☑ Visible
PlotChar (character markers)
| Control | Field | Values |
|---|---|---|
| Color swatch (per slot) | color_overrides[i] | Color picker |
| Character | char_value | Single-character text input. The character drawn on each bar. |
| Location | location | Dropdown — see Location table below |
| Size | size | Dropdown — see Size table below |
| Visibility | visible | Checkbox |
PlotShape (shape markers)
| Control | Field | Values |
|---|---|---|
| Color swatch (per slot) | color_overrides[i] | Color picker |
| Shape | shape | Dropdown — see Shape table below |
| Location | location | Dropdown — see Location table below |
| Size | size | Dropdown — see Size table below |
| Visibility | visible | Checkbox |
PlotArrow (directional arrows)
PlotArrow has two separate color groups — up-arrows and down-arrows:
| Control | Field | Notes |
|---|---|---|
| Up color swatches | color_overrides[0..up_len] | Label: "Up Color". One swatch per distinct up-arrow color. |
| Down color swatches | color_overrides[up_len..] | Label: "Down Color". Offset by up_colors.len() from the config. |
| Visibility | visible | Checkbox |
PlotCandle (OHLC candles)
PlotCandle has three color groups with a flat color_overrides layout:
| Control | Override offset | Label |
|---|---|---|
| Body color swatches | 0..body_len | "Body" |
| Wick color swatches | body_len..body_len+wick_len | "Wick" |
| Border color swatches | body_len+wick_len.. | "Border" |
| Visibility | visible | Checkbox |
Where body_len = colors.len(), wick_len = wick_colors.len() from the config.
PlotBar
| Control | Field |
|---|---|
| Color swatch (per slot) | color_overrides[i] |
| Visibility | visible |
BackgroundColor (bg_color)
| Control | Field |
|---|---|
| Color swatch (per slot) | color_overrides[i] |
| Visibility | visible |
Fill
| Control | Field |
|---|---|
| Color swatch (per slot) | color_overrides[i] |
| Visibility | visible |
Shared Enum Values
Location (for PlotChar / PlotShape):
| Value | Description |
|---|---|
AboveBar | Above the candlestick |
BelowBar | Below the candlestick |
Top | Top of the pane |
Bottom | Bottom of the pane |
Absolute | Y position from the series float value |
Size (for PlotChar / PlotShape):
| Value | Description |
|---|---|
Auto | Automatic sizing |
Tiny | Smallest |
Small | Small |
Normal | Default |
Large | Large |
Huge | Largest |
Shape (for PlotShape):
| Value | Description |
|---|---|
XCross | X shape |
Cross | + shape |
Circle | Filled circle |
Diamond | Diamond |
Square | Filled square |
TriangleUp | Upward triangle |
TriangleDown | Downward triangle |
ArrowUp | Upward arrow |
ArrowDown | Downward arrow |
Flag | Flag |
LabelUp | Label pointing up |
LabelDown | Label pointing down |
Color Picker
Each color swatch, when clicked, should open a color picker with:
- Preset palette — a grid of common colors (e.g., 6×6).
- Hex input — a text field accepting
#RRGGBBformat. - Alpha slider — 0–255 range controlling the alpha channel.
Color encoding: Colors are packed u32 values in RGBA format: (R << 24) | (G << 16) | (B << 8) | A.
// Extract components from Color
let r = color.r(c);     // 0–255
let g = color.g(c);   // 0–255
let b = color.b(c);    // 0–255
let a = color.alpha();   // 0–255

// Create from components
let color = Color::from_rgba(255, 0, 0, 255); // opaque red
For display in CSS: rgba({r}, {g}, {b}, {a / 255}).
Color Override Encoding
The color_overrides array aligns with the color slots in SeriesGraphConfig:
- Single-segment types (Plot, PlotChar, PlotShape, PlotBar, BackgroundColor, Fill):
color_overrides[i]maps tocolors[i]. - PlotArrow:
color_overrides = [..up_colors | ..down_colors](concatenated). Firstup_colors.len()entries are up-arrow overrides, remaining are down-arrow. - PlotCandle:
color_overrides = [..colors | ..wick_colors | ..border_colors](concatenated).
A None entry means "keep the original color". A Some(color) entry replaces the original.
Applying Visual Changes
let mut config = cv.script_config(id).unwrap_or_default();
let ovr = config.series_overrides.entry(graph_id).or_default();

// Override the first color slot to red
ovr.color_overrides = vec![Some(Color::from_rgba(255, 0, 0, 255))];

// Change plot style to histogram
ovr.style = Some(PlotStyle::Histogram);

// Hide this series graph
ovr.visible = false;

cv.set_script_config(id, config);
Visual-only changes re-render immediately without re-executing the script.
Effective Value Resolution
When displaying the current value of a property in the UI, resolve with three-level fallback:
- Override value (from
SeriesGraphOverride) — if set, use it. - Config default (from
SeriesGraphConfig) — the script's original value. - Theme default — fallback color from the chart theme's color palette.
Reset to Defaults
To reset all overrides and inputs to their original values:
let mut config = ScriptConfig::default();
// Re-populate input_values from each InputInfo's default_value
for input in &inputs {
    config.input_values.insert(input.idx, input.default_value.clone());
}
// strategy_config_override is None by default — no explicit clear needed
cv.set_script_config(id, config);
This clears all series_overrides, strategy_config_override, and resets inputs to script defaults, triggering a full re-execution.
Event Flow Summary
User clicks ⚙ on legend toolbar
    ↓
cv.on_mouse_up(x, y)  →  click gesture detected  →  ChartEvent::ConfigureScript(id) pushed
    ↓
cv.poll_event()  →  host receives ConfigureScript(id)
    ↓
cv.tag_for(id)                   → script tag for display
cv.script_inputs_effective(id)   → Vec<InputInfo> with current values
cv.graph_configs(id)             → SeriesGraphConfig per graph
cv.script_overrides(id)          → current visual overrides
    ↓
Your app opens config dialog
    ↓
User edits input or visual property
    ↓
Build ScriptConfig { series_overrides, input_values, strategy_config_override }
cv.set_script_config(id, config)
    ↓
Chart re-renders (visual-only) or re-executes (input or strategy config change) automatically
    ↓
If inputs changed, re-fetch graph_configs (plot structure may change)
    ↓
User clicks OK → close dialog
Save snapshot for persistence
Reference implementation: See ScriptConfigDialog.vue in the web playground for a complete implementation of this UI pattern.