
Cross-Symbol & Multi-Timeframe
request.security() evaluates an expression in the context of a different symbol and/or timeframe, and returns the result aligned to the current chart bar. It is the primary way to access multi-timeframe (MTF) data and data from other instruments in Navi.
Basic Syntax
request.security(symbol, timeframe, expression, gaps, lookahead, ignore_invalid_symbol, currency, calc_bars_count)| Parameter | Type | Description |
|---|---|---|
symbol | string | Symbol identifier, e.g. "NASDAQ:AAPL" or syminfo.tickerid |
timeframe | string | Timeframe string, e.g. "D", "W", "60" |
expression | any series | Expression evaluated on the requested symbol/timeframe |
gaps | BarmergeGaps | BarmergeGaps.Off (default) or BarmergeGaps.On — whether to fill gaps with na |
lookahead | BarmergeLookahead | BarmergeLookahead.Off (default) or BarmergeLookahead.On |
ignore_invalid_symbol | bool | If true, return na instead of error for unknown symbols |
currency | string | Currency for price conversion |
calc_bars_count | int | Optional positive limit for how much recent request history is loaded |
Simple Examples
Higher timeframe close
indicator("Weekly Close on Daily Chart", overlay: true);

let weekly_close = request.security(syminfo.tickerid, "W", close);
plot(weekly_close, "Weekly Close", color: color.BLUE);
Another symbol
indicator("SPY on AAPL chart", overlay: false);

let spy_close = request.security("AMEX:SPY", "D", close);
plot(spy_close);
Higher timeframe indicator
indicator("Weekly RSI");

let weekly_rsi = request.security(syminfo.tickerid, "W", ta.rsi(close, 14));
plot(weekly_rsi);
hline(70);
hline(30);
Timeframe Strings
| String | Meaning |
|---|---|
"1", "5", "15", "60" | Minutes |
"D" | Daily |
"W" | Weekly |
"M" | Monthly |
"3M", "6M" | Multi-month |
Use timeframe.period to reference the chart's own timeframe.
calc_bars_count
Use calc_bars_count when a request only needs a short recent window.
- A positive value asks the provider for at most that many recent bars for the requested stream.
nakeeps the stream uncapped.
let recent_weekly = request.security(syminfo.tickerid, "W", close, calc_bars_count: 2);Gaps
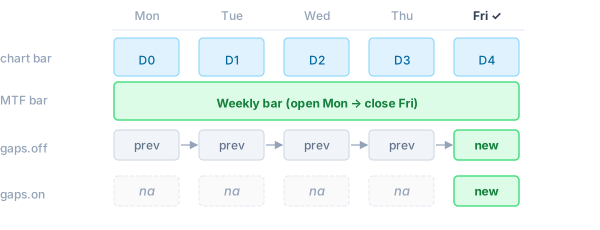
When the requested timeframe is higher than the chart timeframe, a new higher-TF bar closes less frequently than the chart advances.
BarmergeGaps.Off(default): the last known value is carried forward — the series has nonavalues between higher-TF bar closes.BarmergeGaps.On: anais emitted for every chart bar where the higher-TF bar has not yet closed.
// Carry-forward (default): weekly_close is always defined
let weekly_close = request.security(syminfo.tickerid, "W", close);

// Gap-fill: na on all days except Friday (when the weekly bar closes)
let weekly_close_gaps = request.security(syminfo.tickerid, "W", close, gaps: BarmergeGaps.On);
Lookahead
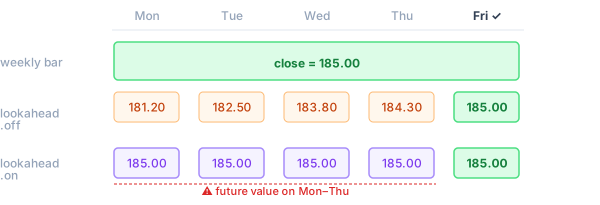
BarmergeLookahead.On makes the expression see the final value of the higher-TF bar from the very first chart bar within that period, rather than the still-forming value. This can introduce future leak into historical bars — only use it when intentional.
// Default: sees the forming weekly close (updates throughout the week)
let weekly_open = request.security(syminfo.tickerid, "W", open);

// With lookahead: sees the confirmed weekly open immediately on Monday
let weekly_open_confirmed = request.security(syminfo.tickerid, "W", open, lookahead: BarmergeLookahead.On);
var and varip Variables
var and varip variables cannot be declared inside the expression argument. To accumulate state across bars on the requested timeframe, declare the variable at the top level of the script. The sub-instance runs the full program body on the requested symbol/timeframe, so top-level var state is maintained per call site independently of the main chart:
indicator("Cumulative Volume (Weekly)");

// Declared at top level — the sub-instance accumulates this on weekly bars
var cum: float = 0.0;
cum += volume;

let weekly_cum_vol = request.security(syminfo.tickerid, "W", cum);
plot(weekly_cum_vol);
Each request.security call site has an isolated sub-instance — its var state is independent of the main script and of other request.security calls.
Tuples
An expression can return multiple values as a tuple:
indicator("Weekly OHLC");

let (w_open, w_high, w_low, w_close) =
    request.security(syminfo.tickerid, "W", (open, high, low, close));

plot_candle(w_open, w_high, w_low, w_close);
ignore_invalid_symbol
Use this flag when the symbol might not exist in the data provider:
let price = request.security("SOME:SYMBOL", "D", close, ignore_invalid_symbol: true);
// price is na if the symbol is not recognised; no runtime error is raised
Without this flag, an unrecognised symbol raises a runtime error and halts execution.
request.security_lower_tf
For lower timeframes, use request.security_lower_tf. It returns an array<T> containing every sub-bar value within the current chart bar, in ascending order:
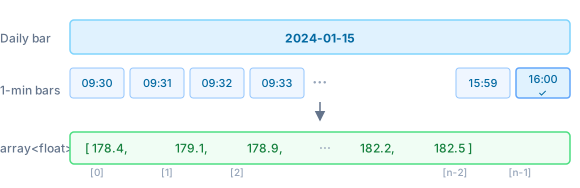
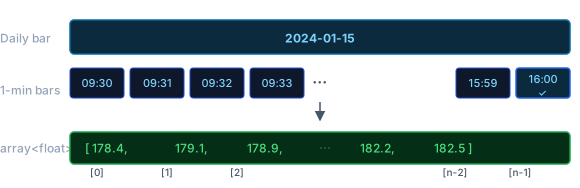
indicator("Intraday highs on Daily chart");

// Returns an array of all 1-minute highs within each daily bar
let minute_highs = request.security_lower_tf(syminfo.tickerid, "1", high);

// Highest 1-minute high within the current daily bar
let intraday_high = array.max(minute_highs);
plot(intraday_high);
The array is empty (array.size() == 0) for bars where no sub-bars are available.
Ticker Expressions
A ticker expression is a string that combines multiple symbols using arithmetic operators. Navi decomposes it into individual DataProvider requests, evaluates the expression per bar, and returns the result as a single series.
Supported operators
| Operator | Example | Result |
|---|---|---|
* | "AAPL*2" | symbol value × scalar |
/ | "AAPL/SPY" | ratio between two symbols |
+ | "AAPL+MSFT" | sum of two symbols |
- | "AAPL-MSFT" | difference of two symbols |
Operands can be symbol strings ("EXCHANGE:TICKER") or numeric literals. Standard operator precedence applies; use parentheses if needed.
Examples
Weighted blend (50/50 portfolio)
let blend = request.security("NASDAQ:AAPL*0.5+AMEX:SPY*0.5", "D", close);Relative performance (ratio)
// AAPL price relative to SPY — how many SPY shares does one AAPL buy?
let ratio = request.security("NASDAQ:AAPL/AMEX:SPY", "D", close);
plot(ratio);
Spread (difference)
// Gold/Silver spread
let spread = request.security("COMEX:GC1!/COMEX:SI1!", "D", close);
plot(spread);
Multi-symbol index
// Equal-weight average of four tech stocks
let tech = request.security(
    "NASDAQ:AAPL*0.25+NASDAQ:MSFT*0.25+NASDAQ:GOOGL*0.25+NASDAQ:AMZN*0.25",
    "D",
    close
);
plot(tech);
How it works
For an expression like "AAPL*0.5+SPY*0.5", Navi:
- Extracts each symbol (
AAPL,SPY) and fetches their candlestick data viaDataProvider. - On each bar, evaluates the arithmetic expression using the requested
expressionfield (e.g.close) from each symbol's sub-instance. - Returns the computed scalar result aligned to the chart bar.
Each symbol in the expression is subject to the same max_security_calls limit as a regular request.security call.
Limitations
- Nesting depth: by default, an expression inside
request.securitymay itself callrequest.securityup to 3 levels deep (configurable viaExecutionLimits::max_security_depth). - Call site limit: each unique
(symbol, timeframe)pair counts towardExecutionLimits::max_security_calls(default 40).
See Also
- Data Providers — supplying candlestick data for
request.security() - Security & Limits — nesting depth and call count limits